Friday, December 18, 2009

Carl Jung’s Red Book - The Archetypal Philosopher in search of his soul


Carl Jung had a real mid-life crisis - the loss of his soul. The Red Book is his personal recording in art and calligraphy done over the 10 years from 1910 to 1920 during which he sought inwardly for the soul he had lost. The book lay in a safe deposit vault in Zurich for several decades and was just released to the public in an exhibit at the Rubin Art Museum in New York Here's what blogger The Beautiful Brain said about the exhibit:
'The magic in this exhibit is in its reminder to the contemporary viewer of the powers of introspection, the sense that there are vast worlds within each of us that await the curious traveler.'
REVIEW: Jung’s Red Book Unveiled in Manhattan�|�The Beautiful Brain

Be sure to watch the video embedded below. It is is a thrilling glimpse into the digital capture of the Red Book for broader publication. View the video in full screen for maximum impact. I intend to read the Red Book to see how Jung found his soul after scouring his inner mind for guidance.

Reblog this post [with Zemanta]

Tuesday, November 03, 2009

CONTINUOUS PARTIAL ATTENTION - AGAIN

This image from VisualsSpeak artist Christine Martell shows how I feel when I consider the CPA dilemma of my digital lifestream. I mentioned Linda Stone's coinage of the term CPA here Thoughts Illustrated: Who is Linda Stone and why should we listen to her?

Christine places this image in her Options portion of the VisualsSpeak image gallery. Take a look - you might find just the image you need from her expanding collection, mostly from her own artistry.VisualsSpeak LLC

Wednesday, October 07, 2009

rypple - find out what people really think about you


John Kelleher from Rypple on Vimeo.


This testimonial video is a strong example of the use of Vimeo and also an introduction to Rypple - a social networking tool of real value.

Reblog this post [with Zemanta]

Leveraging your presentation power

Image representing Rashmi Sinha as depicted in...Image by SlideShare via CrunchBase

I have been an avid fan of SlideShare since it launched - it has all the elements of DonTapscott's Wikinomics: Open, Peering,Sharing, Global. IMO Slideshare for Business is a brilliant commercial move for the company.

Rashmi Sinha(shown here) is the genius behind the company.

Check out this SlideShare Presentation, which exemplifies Presentation Zen it its style and will give you another way to unlock the value in your presentations.


Reblog this post [with Zemanta]

Thursday, September 24, 2009

Finally! a formula for valuing internet startups


At last we have the formula for valuing internet startups! Here it is:

"In order to determine the valuation of companies, Bhatnagar typically applies the following formula: [(Twitter followers x Facebook fans) + (# of employees x 1000)] x (RSS subscribers + daily page views) + (monthly burn rate x Google’s stock price)2 and then doubles if it they use Ruby on Rails or if the CEO has run a business into the ground before. Bhatnagar admits the math is mostly a guess but points out that “the press eats it up.”

Thanks to Jason Freid for his priceless sense of humor.

PRESS RELEASE: 37SIGNALS VALUATION TOPS $100 BILLION AFTER BOLD VC INVESTMENT - (37signals)

##

Thursday, September 10, 2009

web meetings on my iPhone

WebEx CommunicationsImage via Wikipedia

I just got a new iPhone - and my first use will be a Virtual Visuals test using the Webex meeting app. View the video for a taste.


Reblog this post [with Zemanta]

Wednesday, September 09, 2009

to Tweet or not to Tweet

Image representing Robert Scoble as depicted i...Image via CrunchBase


I am not a Twitterer and I have resisted the pressure to join the mob - since I was first introduced to Twitter over two years ago by the biggest Twit of them all - Robert Scoble Thoughts Illustrated: Lunching with Scoble and by my then working colleague Critt Jarvis.

So I was enlightened by this recent "study" Twitter Study Reveals Interesting Results - 40% is "Pointless Babble" | Pear Analytics and downloaded the Pear Analytics White Paper pdf from this link. If you are the least bit interested in Twitter - get the White Paper for yourself.

This all started up again this morning by a tweet from Critt, whom I have been mostly out of contact with, and a link to his blog Why Scoble's Twitter valuation is correct... | Critt Jarvis where I get Critt's "i told you so!" treatment.

The upshot of all this Twittering is the recognition, seldom revealed to infrequent Twitter users, that the combination of a tweet with a link to a more in-depth post of some consequence to the recipient of the tweet does have value - as I mentioned here a year ago Thoughts Illustrated: from twitter to youtube - nice segue from Garr Reynolds

All of which once againn proves that you can eat up a lot of time on Twitter even if you rarely use it. Preparing this post which resulted from Critt's tweet has taken me back to my TI archives and an elapsed time of 23 minutes stolen from my continuous partial attention stream this morning.

Did I learn anything useful in reading the Twitter Study? Did you? Was it Pointless Babble or a weird extension of a dangling conversation that started more than two years ago? What it did do is make me review my blog "memory" to recall the thread on Twitter started in March of 2007 during my lunch with Scoble.

Scoble, Critt and I have gone our separate ways since then, but this morning's tweet brought it all back - and presented me with a reason to reconsider Twitter as a social media tool of value.


Reblog this post [with Zemanta]

Tuesday, July 28, 2009

Visual Gisting - How to Improve your Return on Attention (ROA).

The theme of this blog: Thoughts Illustrated -- is based on the old adage that "a picture is worth a thousand words"

In this post, I will give you an example of the value of that old adage.

If you listen to a standard speech with no long pauses it would be about 70 words per minute
( source WikiAnswers)


click on the image for a bigger version.


Yesterday I listened to a 45 minute YiTan call-in conference conversation between Jerry Michalski and Doug Rushkoff , author of Life Inc. (Estimated word count 3150 words, elapsed time 2700 seconds)

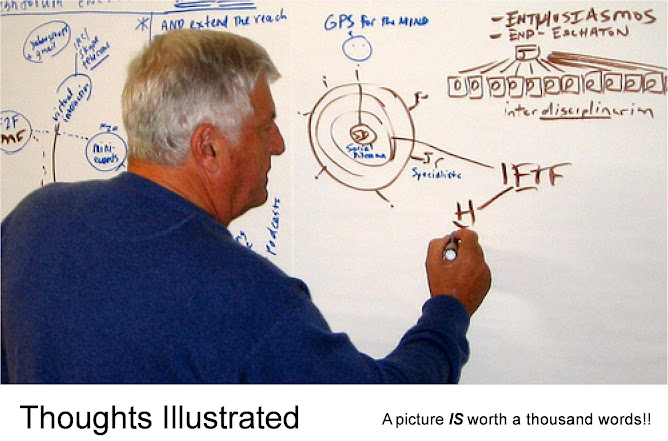
The image above is a "visual gist" created by my partner Joe Sterling as he listened in to the call. IMO it contains the essence of the conversation and can be scanned in less than 10 seconds to get the gist. ( 3150 words= 270o seconds, gist =10 seconds - ROA 270X) Also, you can select
certain "objects" from the visual gist , and , in the very near future we will enable"hot spots" on these images so that when you "mouse over" an object or text item in the visual gist, you will be linked directly to a brief snippet from the full audio track saved in the YiTan archive, and if you find the snippet(s) interesting, you can then download the full audio podcast into your iTunes playlist for later listening as a part of your personal knowledge library.

OR, you can learn more about Doug's book from from Amazon and.......
ROA analysis:
  1. The visual gist can be scanned in 10 seconds, and you can ( when we have it activated) link directly to the snippet of the audio podcast from YiTan and listen just to that snippet( 30 -60 seconds) So far: Total elapsed time 40 seconds.
  2. You can continue the snippet process from #1 above to link to other audio clips related to objects on the image, or you can save the full podcast to your audio library on iTunes (30 seconds)
  3. The visual gist can be "played back" in synchrony with the podcast, so that you will SEE the visual unfolding along with the audio stream. Or you can turn off the sound and just watch the picture play forward. (This is not a great ROA, but it might suit your viewing/listening style)
  4. You can share the visual gist with any one and soon you will be able to annotate the image with tags and hotspot links of your own, including other resources on the internet that relate to the visual gist
  5. By saving your visual gists into a gallery of images, you can easily scan your collection of visuals quickly and link from the gallery to the full multimedia archive of your knowledge library.
So, to summarize,visual gisting is a powerful way to gain Return on Attention. To bring this powerful visual capability to anyone, anywhere, any time, we are training a cadre of master visualizers to use new digital tools that can link them to any webmeeting, or audio conference to do what Joe did during yesterday's YiTan call.

If you want to know more about how you can employ visual gisting in your webmeetings or conference calls, please leave a comment or visit Home Page

Wednesday, July 08, 2009

Tom Wujec - BigViz Revizited


In this brief TED talk, Tom Wujec shows how the brain works visually to create and share meaning. The video track segment from 2:00 to 4:30 provides the gist of his talk. Click below to play.


For related posts click on BIGVIZ in the left sidebar list of tags.

Sunday, June 28, 2009

The Future Internet from the European Union


Anticipating that every idea, thing, person, process in the world is becoming linked on the net 24/7, the EU is investing in the Semantic Web as a solution for the overwhelming flood of data.

This short, animated whiteboard video clip offers a timely look into the what the EU calls the Future Internet.

Hat tip to Rob Kruse of Venlogic for the link

Click below to play


Saturday, June 20, 2009

"He's Barack Obama" --a cool "sendable"from JibJab

JibJab leverages the Obama "brand" to promote its e-card Sendables and offers a behind the scenes look at how they produced this cooool Sendable.

I am going "backstage" to see how JibJab does it and will post my findings on their "secret sauce".


Click on the arrow to play and enjoy!


Try JibJab Sendables® eCards today!

Sunday, May 24, 2009

Semantic Web Marketing explained - by Scott Brinker -

Here's a sneak preview of a presentation that Scott Brinker, an SEO marketing guru will be presenting at the Semantic Technology Conference on June 16 in San Jose.

I post it here for 3 reasons:
  1. It exemplifies the best practices of Garr Reynolds Presentation Zen Thoughts Illustrated: Ah So! PresentationZen - a book every presenter must read
  2. It describes a difficult concept ( Semantic Marketing) in a simple, powerful way
  3. It defines an early adopter business model for "semantic savvy" devolopers.
Kudos to Scott and to Rob Kruse of Venlogic for the link.

You may want to click on the slideshare logo to get a full screen version of the presentation which is embedded below:

Friday, May 15, 2009

Game Web 2.Over? - "crossing out" the Web 2.0 dropouts


a neat way to show the dropout rate of previous Web 2.0 companies - cross out their logos. For the full article click here:

Game Web 2.Over? - meish dot org: life, unfolding

##

Wednesday, May 06, 2009

Creating a New MInd - a visualization

This from Francesco Mungai's Photostream on Flickr.


Click for a larger image to see if it affects you as much as it does me.

and if it does then visit Francesco's website to scroll through a great collection of infographics.

50 great examples of infographics - FrancescoMugnai.com

Saturday, May 02, 2009

Obama's inauguration speech - Two ways of looking at it.

The New York Times Visualization Lab produced this "wordle" of President Obama's inauguration speech.


The image below is how Graphic Muralizer Stephanie Crowley "pictured" the speech.


Click on each image to get a better view. Which image do you prefer? I vote for Stephanie's.

##

Tuesday, April 14, 2009

Mike Arauz | Blog: Spectrum of Online Friendship


From a David Armano Tweet -

click on the image for a better view.

High "chunk" visualization - nice job Mike arauz - link below:

Mike Arauz | Blog: Spectrum of Online Friendship

##

Sunday, April 12, 2009

Armano on the move - to Austin and a new career

Anyone who has followed my scribblings has recognized my appreciation for David Armano's work and his generous contributions to the creative commons of impactful visuals to explain the reach and power of social media. David epitomizes the values of the Creative Commons.

Here's a quote from his blog announcing a major change in David's life and work:

"There has to be a systematic bottoms up and tops down transformation starting with strategy and supported by the right types of technology which can enable more effective human and system interactions. This is the place we hope to play in.
I look forward to playing with David in that same place.

Logic Emotion: And Now For Something Completely Different:

Tuesday, March 31, 2009

alan watts and the journey

I have always admired Alan Watts and used his books way in the distant past to help me understand life's journey. Here in a brief (2min) video Alan narrates a cartoon titled Music and Life. enjoy!

Friday, March 27, 2009

Michael Jordan - on Failure

This puts another twist on the old proverb:
"If at first you don't succeed, try, try again."


##

Wednesday, March 04, 2009

The Simplicity Cycle by Dan Ward

Most cliches find their origin in truth, and 'less is more' is one that rings true to me.

Dan Ward succinctly shows us that increased complexity does not inherently equal increased goodness and instructs us on how to walk that fine line while still innovating.

Thoughts Illustrated: The Simplicity Cycle - A manifesto

Now the manifesto has been published as an ebook( free)and a paperback($9.95)

Dan's version 1.0 is shown here


And version 2.0 was in the manifesto.


I have downloaded the ebook and will also buy the paperback for my library and I encourage you to do the same. To get the book link below:

The Simplicity Cycle by Dan Ward (Book) in Engineering:

##

Armano again - This time on the Passion Files.

This slideshare audiocast illustrates the use of SlideShare audio casting and David's unique ability to use his Library of visuals to support his responses to interviewer Sean's questions.

I will be subscribing to both David's blog and Sean Howard's Passion Files to keep my passion for visual thinking up to speed and up to date.

Take a look - 11 minutes and worth it.

Tuesday, March 03, 2009

Concept Workers - Visual Thinkers?

From Tony Karrer's blog:

"That's why I'm liking the idea of referring to work that involves figuring out unknowns as concept work and the people doing this work as concept workers."
Concept Worker : eLearning Technology

Concept workers need visuality. ( a term coined by Kevin Kelly here Thoughts Illustrated: Kevin Kelley on Visuality ( NYT)

##


Monday, March 02, 2009

A new take on a famous optical illusion

Here's a new way to visualize this famous optical illusion - Youtube it!

Tuesday, February 17, 2009

The Innovation Economy - INGENESIST


IN this slide deck (embedded below) , Daniel Robles explains his unique vision for an Innovation Economy. His concepts of information, knowledge and innovation shown in the slide above are the driving forces for his Open Source project : Ingenesist - . You can view his presentation on this page or see a larger size version by clicking on the slideshare logo at the bottom right of the presentation .

I had run across Dan's vision over a year ago and posted on it here Thoughts Illustrated: The Great Train Wreck of Social Networks - can we be saved?

Here's the slide deck:

Monday, February 16, 2009

Barack, Inc. - leveraging the President's brand


In very clever play on Obama's use of social networking to catapult him into the presidency, and trading on the popularity of the Obama "brand", Barry Libert and Rick Faulk (Chairman and CEO respectively of Mzinga- a social networking service) have rushed an Obama book into publication that is a not-too-subtle promotion for Mzinga services.

This link to Mzinga is on the landing page of the Barack, Inc blog:


Barack, Inc. blog

##

Kevin Kelley - the next 5,000 days of the Web


These are the last two slides in a 20 minute presentation by Kevin Kelley - IMO a person who articulates our web experience now and in the future better than anyone.

I think his whole talk ( from TED Talks) is worth listening to so you will understand what Kevin means by "ONE".

Kevin Kelly on the next 5,000 days of the web | Video on TED.com

##

The Fast Company 50 - 2009: Team Obama is Number 1


"The year's most successful startup took a skinny kid with a funny name and turned him into the most powerful new national brand in a generation."


The infographic shown above features an animated timeline chart of key news clips of the Obama campaign.(To see the animation click on the link below.)

The Fast Company 50 - 2009: Team Obama | Fast Company


##

Tuesday, February 10, 2009

Generation WE - Yes we can!


I have 12 grandchildren ages 8 - 26 who are all part of Generation WE, and I am really enthused about the potential they and their generational cohorts have to effect the important changes they need to achieve a sustainable future.

They have already made their political clout evident as they turned out in massive numbers to vote for Obama - and they now have a taste of what it is like to play an active role in making our world a better place.

My primary purpose in life is to help Generation WE to design and implement an audacious project: Project Free: Generation WE: A Generation 95 Million People Strong

Saturday, February 07, 2009

The Visual Repertoire of Obama’s Run for the White House

I've been quiescent on this blog for several months due to radiation therapy which sapped my energy and interest in things visual - so, as a restart to my visual journal, i have clipped just a couple of images from a remarkable visual overview of Obama's run for the White House. Published by the Parson's Institute for Information Mapping and originally compiled by the Information Design Studio in Amsterdam.


Click here to scroll through the visual history of Obama's campaign:

The Visual Repertoire of Obama’s Run for the White House

Tags

ShareThis

Blog Archive

Ti panel